
Table of Contents
The BCG Matrix, also known as the Boston Consulting Group Matrix, is a popular strategic management tool used by businesses to analyze and classify their product or service portfolio. Developed by Bruce D. Henderson in the 1970s, this matrix offers a visual representation of a company’s products or services in a way that helps managers make informed decisions about resource allocation and growth strategies. In this blog post, we will delve into what the BCG Matrix is, how it works, and how businesses can effectively use it to manage their product or service offerings.
What is the BCG Matrix?
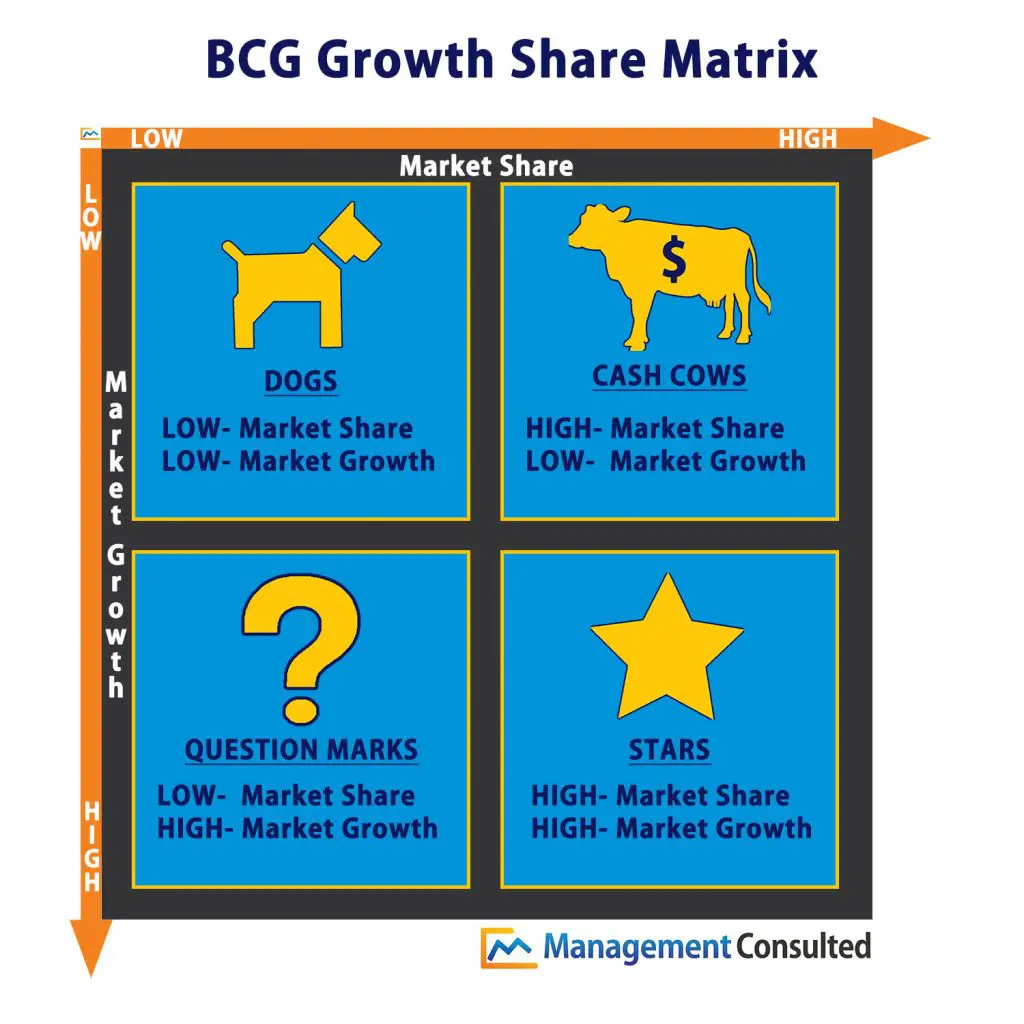
The BCG Matrix is a four-quadrant chart that categorizes a company’s products or services based on two key factors: market growth rate and market share. These factors are represented on the axes of the matrix.
Here’s a quick overview of the four BCG Matrix quadrants:
- Cash Cows:
- High Market Share, Low Market Growth: Products or services in this category are typically well-established and dominant in the market.
- Strategic Approach: Maintain and maximize cash flow by harvesting profits, invest cautiously to maintain market share.
- Dogs:
- Low Market Share, Low Market Growth: Products or services with a low market share in a slow-growing or stagnant market.
- Strategic Approach: Consider discontinuing or divesting these offerings unless they have some strategic value or support other products.
- Question Marks (or Problem Children):
- Low Market Share, High Market Growth: Products or services in emerging or rapidly growing markets but with low market share.
- Strategic Approach: Invest in these products to increase market share and potentially turn them into Stars or consider divesting if they don’t show promise.
- Stars:
- High Market Share, High Market Growth: Products or services that dominate in fast-growing markets.
- Strategic Approach: Invest heavily to maintain or expand market share, as they have the potential to become future Cash Cows.
How to Use the BCG Matrix Effectively
- Identify and Analyze Products/Services: Begin by identifying each of your products or services and placing them on the BCG Matrix according to their market share and market growth.
- Allocate Resources: Based on the matrix, allocate resources accordingly. Cash Cows require minimal investment but provide steady cash flow. Stars need heavy investment to capture market share. Question Marks need strategic investments to determine their future potential, and Dogs may need to be divested.
- Regular Review and Adjustment: Markets change over time, so it’s essential to regularly review and adjust your product or service portfolio within the BCG Matrix. What was a Question Mark might evolve into a Star or a Cash Cow with the right strategy.
- Portfolio Diversification: Consider how your products or services are distributed across the matrix. A balanced portfolio may involve a mix of Cash Cows, Stars, Question Marks, and a few Dogs to mitigate risk.
- Strategic Decision Making: Use the insights gained from the BCG Matrix to make informed strategic decisions. This tool can guide product development, marketing, and resource allocation strategies.
Example/Template: BCG Matrix Analysis of Coca-Cola
Coca-Cola, a globally renowned leader in the ready-to-drink beverage industry, boasts an extensive portfolio of over 500 beverage brands, ranging from Fuse Tea and Oasis to Lilt and Powerade. However, when it comes to brand awareness, revenue, and profitability, none of these brands come close to the iconic Coca-Cola.
- Step 1: Select the Company/Product/Brand Our chosen subject for analysis is the Coca-Cola Company. We will be focusing on its various offerings in the beverages market, including diet sodas and mineral water.
- Step 2: Calculate Relative Market Share and Determine the Market Growth Rate Coca-Cola’s market presence is truly impressive, with a global footprint spanning more than 200 countries. This wide-reaching market presence is a testament to its dominant position in the beverage industry.
- Step 3: Create the Matrix and Position the Products
- To complete the BCG Matrix analysis, we need to place Coca-Cola’s various products and brands in the matrix based on their market share and the market growth rate. This step will allow us to visualize and categorize these offerings as Cash Cows, Dogs, Question Marks, or Stars.
Explanation of Each BCG Matrix Category
Cash Cows:
Cash cows are products or business units that enjoy a commanding position in a market with slow growth. They are like the reliable workhorses of a company, consistently generating more cash than is necessary to sustain them. These assets are often considered “boring” because they are in mature markets, but their value lies in their ability to generate steady profits. The strategy for cash cows is to maintain them with minimal investment, as further resources wouldn’t yield substantial returns in a sluggish industry. In essence, you continue to “milk” these assets for all the cash they can provide, as they are your cash generators.
Dogs:
Dogs represent the least desirable quadrant in the BCG Matrix. They are products or business units with a small market share in a market that’s both mature and slow-growing. These entities don’t have a promising future within the company. Dogs either break even, produce minimal cash, or even drain the company’s resources. Although they might serve as employment sources and potentially offer cost benefits or synergies, the opportunity cost of allocating resources to more promising products is simply too high. The best approach with dogs is to divest them by selling to another company.
Question Marks:
Question marks are business units with a low market share in a high-growth market. They are products or services that initially absorb more cash than they generate, as they require substantial investments to fuel their growth. Question marks are aptly named because their future is uncertain; they can either transform into stars, and eventually cash cows, as the industry matures, or they may fail to gain traction and become dogs. To manage question marks, companies must conduct thorough analyses to determine whether the required investments are justified in their quest to gain market share.
Stars:
Stars are business units with both high market share and presence in a rapidly growing industry. They are market leaders, often with monopolistic qualities resulting from strong competitive advantages or fortuitous timing. Stars are cash magnets – the more you invest in them, the more excess cash they generate. These assets are extraordinarily valuable to a company. The expectation is that, as the industry’s growth rate eventually slows down, stars will evolve into cash cows. So, stars are the stars of your portfolio, with the potential to shine even brighter in the future.
Advantages/Benefits of BCG Matrix
- Simplicity and Ease of Understanding:
- The BCG Matrix is a straightforward and intuitive tool. Its simplicity makes it easy for both executives and employees at all levels of an organization to grasp and use effectively. This ease of understanding encourages broad adoption within the company.
- Volume and Experience Effects:
- Larger companies can benefit from the BCG Matrix by leveraging volume and experience effects. By categorizing products or business units into Cash Cows, Stars, Question Marks, and Dogs, larger organizations can better allocate resources and optimize their product portfolio, taking advantage of economies of scale and experience-driven efficiencies.
- Predictive Value:
- The BCG Matrix has predictive value, as it categorizes products based on their current market positions and growth potential. This allows companies to anticipate the future actions of their products or business units. Consequently, organizations can make more informed decisions regarding resource allocation and management strategies.
- Product Portfolio Analysis:
- The BCG Matrix is a valuable tool for analyzing a company’s product portfolio. It helps businesses assess the performance and potential of their various products or services, facilitating strategic decision-making. This analysis can guide product development, marketing, and investment strategies.
- Emphasis on Cash Flow and Investment Characteristics:
- The BCG Matrix places a strong emphasis on cash flow, drawing attention to the investment characteristics of different products or business units. By categorizing products as Cash Cows, Stars, Question Marks, or Dogs, companies can tailor their investment strategies to maximize cash generation and profitability.
- Balance Evaluation:
- The BCG Matrix enables managers to evaluate the balance in their company’s current portfolio of products. By visualizing the mix of Cash Cows, Stars, Question Marks, and Dogs, organizations can identify areas that may require adjustments in resource allocation or divestment, ensuring a balanced portfolio.
- Market Share and Profitability Linkage:
- The BCG Matrix highlights the direct relationship between a company’s market share and its profitability. This linkage underscores the importance of increasing market share when it is profitable to do so. Companies can use this insight to develop strategies for market expansion and growth.
- Simplified Classification:
- The BCG Matrix’s four categories—Cash Cows, Stars, Question Marks, and Dogs—provide a simplified way to categorize products or business units. This simplicity makes it efficient and straightforward for managers and teams to work with and make strategic decisions.
Limitations of BCG Matrix
- Lack of Profitability Dimension:
- The BCG Matrix primarily focuses on market share and market growth rate, neglecting the profitability dimension. Some products or business units with low market share may be highly profitable in a slow-growing industry. These products are categorized as “dogs,” but they should not necessarily be viewed negatively if they are efficient at generating profits. Profitability should be considered alongside market share for a more comprehensive evaluation.
- Oversimplification:
- The BCG Matrix oversimplifies the market by relying on just two factors—market share and market growth. This oversimplification can lead to misclassifications, as it doesn’t account for nuanced situations. For instance, a product with low market share in the overall industry may dominate a small, high-growth niche, making it unclear whether it should be classified as a “star” or a “question mark.”
- Limited Market Definition:
- The BCG Matrix defines the market broadly, which can be problematic for companies with diverse product portfolios. It assumes that all products within a company are part of the same market, leading to potential misclassification. In reality, companies often operate in various markets, and this model doesn’t account for these variations.
- Ignores Interactions Among Business Units:
- The BCG Matrix isolates and evaluates business units independently, which doesn’t reflect the interconnected nature of businesses. In some cases, a “dog” might be supporting other products or providing synergies that contribute to the company’s competitive advantage. Focusing solely on market share and growth can lead to misguided decisions about divestment.
- Subjectivity and Data Reliability:
- The accuracy of the BCG Matrix’s classifications depends on the reliability and completeness of the data used. Determining market share and growth rates can be subjective and reliant on available data. Inaccurate data or inconsistent measurement methods can lead to erroneous categorizations, affecting strategic decisions.
Five Easy Steps to do a BCG Matrix Analysis of any Company
Step 1: Choose the Product/Unit
- Select the specific products, business units, brands, or firms that you want to evaluate within your organization. The choice of the unit has a significant impact on the analysis.
Step 2: Define the Market
- Clearly define the market within which your chosen products or business units operate. A well-defined market is crucial to ensure that products are categorized accurately. A market should be defined to match the product’s scope and relevance.
Step 3: Calculate Relative Market Share
- Calculate the relative market share for each product or unit. Relative market share is determined by comparing your product’s sales to the sales of the leading competitor for the same product. It is represented on the x-axis of the BCG Matrix.
Step 4: Find out the Market Growth Rate
- Determine the market growth rate, which is the percentage increase in the total market size. This rate can be obtained from reliable sources or calculated based on the revenue growth of leading firms within the market.
Step 5: Draw the Circles on a Matrix
- Plot each product or unit on the BCG Matrix based on its calculated relative market share and the market growth rate. The x-axis represents relative market share, and the y-axis represents the market growth rate. Create a circle for each unit, and the size of the circle should ideally correspond to the revenue generated by that unit.
Apps/Websites you can use to Create a BCG Matrix Analysis Chart
- Creately is a web-based diagramming tool that offers a variety of templates, including a BCG matrix template. You can customize the template to fit your needs and easily create a professional-looking diagram.
- Visual Paradigm Online is another web-based diagramming tool that offers a BCG matrix template. It also has a variety of other features, such as real-time collaboration and support for a variety of file formats.
- Vizzlo is a web-based charting tool that offers a variety of chart types, including a BCG matrix chart. You can easily create a BCG matrix chart by selecting the appropriate chart type and entering your data.
- EdrawMind is a desktop diagramming tool that offers a variety of templates, including a BCG matrix template. It also has a variety of other features, such as the ability to import and export data from other applications.
- Draw.io is a desktop diagramming tool that offers a variety of templates, including a BCG matrix template. It is also free to use.
- Coursepivot.com is a valuable online platform that offers a unique service for those seeking assistance with their BCG Matrix analysis assignments. While it may not be an app like some other platforms, it provides a convenient and efficient solution for individuals and students looking for help in preparing BCG Matrix papers and analyses for their chosen companies. If you find yourself wondering, “Who will write my BCG Matrix analysis assignment?” coursepivot.com is a top-tier service that can fulfill your needs and provide you with expert support.
Cite this article in APA
If you want to cite this source, you can copy and paste the citation below.
Antony Lawrence. (2023, November 1). What is the BCG Matrix? How to apply the BCG Growth-Share Matrix. EssayHelper.me. Retrieved from https://essayhelper.me/blog/what-is-the-bcg-matrix-how-to-apply-the-bcg-growth-share-matrix/